Glossary – Simulation of telesystems
You are expected to be familiar be all terms in bold typeface.
Matlab and Simulink
MATLAB –
Matrix Laboratory.
Simulink – A graphically programmed
data-flow oriented tool within Matlab for modeling and analysis of dynamic
systems.
Matlab function - .m-file that starts with the
reserved word “function”. May also be an internal function or a compiled function.
Matlab script – .m-file that does not include a
function header. Runs in the workspace.
Toolbox – a set of Matlab-functions and
scripts,
Blockset – a
library of Simulink models.
Signals and signal processing
Signal: A varying physical quantity, for
example a voltage or a current, that can carry
information.
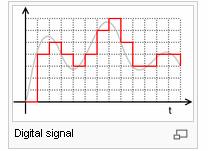
Digital signal: A signal with a finite number of
levels and a certain symbol rate or sample rate. This may be a bit stream
transmitted as a pulse train over a baseband channel. A digital signal may be a
representation of a quantified and discrete-time signal, for example a sampled
and digitized analog signal.
Quantization: Analog-to-digital conversion.
Sampel Rate – The
number of samples per second taken from a analogue continous signal to make a time-discrete signal.
Periodic waveform: A signal that repeats it self at
regular intervals, the so called period
time. Some named examples are since
wave, sawtooth wave, square wave and triangle wave.
Fundamental frequency: Number of periods per second of a
periodic wave form. One divided by the period
time.
Amplitude: Peak voltage or peak current. A nonnegative scalar measure of a wave's magnitude of oscillation,
that is, the magnitude of the maximum disturbance in the medium during one wave
cycle.
Complex representation of a sinewave:
A sinewave of constant amplitude and phase can be
divided into an Inphase
signal with amplitude I, and a Quadrature phase signal, with amplitude Q. The
phase difference between the I and Q signals is 90°.
The sinewave can be represented by a constant complex
number C = I + jQ,
where j is the imaginary unit. This
number can be represented graphically by a two-dimensional vector. The
amplitude of the sinewave is the absolute value of C (the distance between the point C and
origin in the graphical representation), which can be found using Pythagoras’
theorem. The phase of the sinewave is the argument of
C (the angle of the graphical vector
representation). The real component of C
is I, and the imaginary component of C is jQ.
RMS voltage: Root mean square (in Volt). The quadratic mean of a voltage signal. The power or energy
of a signal depends on its RMS value rather than its
amplitude. A DC signal (constant current and voltage) of a certain voltage
gives raise to the same power as an AC signal (alternating current and voltage)
with the same RMS voltage. In case of a sine wave,
the RMS voltage is 71% of the amplitude (the peak
voltage). In case of a square wave, the RMS voltage
is equal to the amplitude. In case of a stochastic (random) signal with mean
value 0, the RMS value corresponds to the standard deviation of the signal.
Power: Energy per time unit, for example
radiated as heat from a resistor, or radio waves from an antenna. Measured in
Watt and defined as![]() ,
where
,
where ![]() is the RMS voltage, and R is the
resistance. Sometimes normalized and measured in Volt2 (V2),
defined as
is the RMS voltage, and R is the
resistance. Sometimes normalized and measured in Volt2 (V2),
defined as ![]() .
.
Signal processing: The analysis, interpretation and
manipulation of signals, for example filtering, equalization, noise
cancellation, source coding, measuring, etc.
Analog signal
processing:
Processing of a signal by means of analog components, for example passive
components such as capacitors, inductors and resistors, but also active
components such as transistors and operational amplifiers.
Digital signal
processing:
Processing of a digitized and sampled analog signal, by means of digital
electronic components and perhaps also software.
Harmonics: Frequency components of a periodic
signal. A periodic signal can be described as a sum of sine waves, each with
different amplitudes and phases. This is called Fourier series development. If the fundamental frequency (the first
harmonic) is f, the second harmonic
has the frequency 2f, the third
harmonic the frequency 3f, etc.
DC (direct current)
component: Mean
value of a voltage or a current.
Spectrum: The frequency domain description
of a signal. The spectrum is typically illustrated as a plot where the
horizontal axis is the frequency, and the vertical axis may be the amplitude
(in Volt), the power (in Watt), the power density (in Watt/Hz) and/or the (in
radians or degrees). The spectrum may correspond to the fourier series development of a periodic (cyclic) waveform, or the fourier transform of a non-periodic signal, expressed as a mathematical function of the
frequency.
Components and algorithms of a digital communication systems
Source coding: Sampling, digitalization and/or
compression. The aim is to minimize the number of bit/s but achieve sufficient
signal quality.
Channel coding: Addition of forward error
correction (FEC) codes and bit interleaving. See
below. Sometimes modulation is also included in the term, but not always.
Multiplex method: A scheme for combining many analog
signals or digital bit streams into a single transmission circuit or channel.
Examples are:
-
Time Division Multiplexing (TDM), using a frame consisting of a a fixed number of timeslots.
-
Frequency Division Multiplexing (FDM), using modulation and a frequency channel per signal.
-
Statistical Multiplexing, for example packet mode
communication.
-
Code Division Multiplexing, also known as spread spectrum
communication, for example frequency hopping or direct sequence code division
multiplexing.
Multiple access
method, or channel access method: a scheme that
allows several terminals connected to the same physical medium to transmit over
it, and to share its capacity. Examples of multiple access methods are time
division multiple access (TDMA) and carrier sense
multiple access with collision detection (CSMA/CD). A
multiple access protocol is synonym
to media access control (MAC).
Examples of circuit mode channel access methods, providing fixed bit rate and
delay: (You are not expected to know all these methods.)
- Frequency division multiple access (FDMA)
- Time-division multiple access (TDMA)
- Code division multiple access (CDMA) or spread spectrum multiple access (SSMA), for example
- Direct-sequence CDMA (DS-CDMA)
- Frequency-hopping
Examples of packet mode channel access methods,
providing varying bit rate and delay:
- Contention based random access methods:
- Aloha
- Slotted Aloha
- Multiple Access
with Collision Avoidance (MACA)
- Multiple Access
with Collision Avoidance for Wireless (MACAW)
- Carrier Sense Multiple Access (CSMA)
- Carrier sense multiple access with
collision detection (CSMA/CD)
- Carrier sense multiple access with
collision avoidance (CSMA/CA)
- Token passing:
- Token ring
- Token bus
- Polling
- Resource reservation (scheduled) packet-mode
protocols:
- Dynamic Time Division Multiple
Access (Dynamic TDMA)
- Reservation ALOHA (R-ALOHA)
Where these methods are used for dividing
forward and reverse communication channels, they are known as duplexing methods, such as:
- Time division duplex (TDD)
- Frequency division duplex (FDD)
Modulation: The process of varying a carrier signal, typically
a sinusoidal signal, in order to use that signal to convey a message signal and
transfer it over an analog bandpass channel. Analog
and digital modulation facilitate frequency division multiplex (FDM), where several low pass information signals are transferred
simultaneously over the same shared physical medium, using separate bandpass channels.
Analog modulation: The aim of analog modulation is to transfer an analog lowpass message signal, for example an audio signal or TV
signal, over an analog bandpass channel, for example
a limited radio frequency band or a cable TV network channel. Example of analog
modulation methods are:
-
Amplitude modulation (AM)
-
Frequency modulation (FM)
-
Phase modulation (PM)
-
Qaudrature modulation (AM), where a cosine and a sine carrier wave of the same frequency are
modulated by two channels, the inphase message signal
(I) and the Quadrature phase message signal (Q) and sumarized.
This results in a combination of AM and PM.
Digital modulation: The aim of digital modulation is to transfer a digital bit stream over an
analog bandpass channel, for example over the public
switched telephone network (where a filter limits the frequency range to
between 300 and 3400 Hz) or a limited radio frequency band. An analog carrier
signal is modulated by a digital bit stream. This can be described as a form of
analog-to-digital conversion. The changes in the carrier signal are chosen from
a finite number of alternative symbols (the modulation alphabet).
Example of digital modulation methods are:
-
Frequency Shift Keying (FSK), where a finite number of frequencies are used, typically two
frequencies.
-
Amplitude Shift Keying (ASK), where a finite number of frequencies
are used, typically two amplitudes.
-
Phase shift Keying (PSK), where a finite number of phases are used for example two (2PSK = BPSK = Binary PSK), 4 (4PSK = QPSK = Quadruple PSK), 8 (8PSK),
16 (16PSK), etc.
-
Differential
PSK (DPSK) and Differential
QPSK (DQPSK). Not sensitive
to constant phase shift.
-
Continuous
phase modulation (CPM), for example Minimum-shift
keying (MSK) and Gaussian minimum-shift keying (GMSK). These can be seen as a mix of PSK
and FSK.
-
Quadrature Amplitude Modulation (QAM), for example 8QAM, 16QAM, etc.
-
Orthogonal Frequency Division
Multiplexing (OFDM), also known as Discrete Multitone (DMT).
Each of these phases, frequencies or amplitudes
are assigned a unique pattern of binary bits. Usually, each phase, frequency or
amplitude encodes an equal number of bits. This number of bits comprises the
symbol that is represented by the particular phase.
If the symbol
alphabet consists of M = 2N alternative symbols, each
symbol represents a message consisting of N
bits. If the symbol rate (also known as the baud rate) is fS symbols/second (or
baud), the data rate is NfS
bit/second.
In the case of QAM, an inphase signal (the I
signal, for example a cosine waveform) and a quadrature phase signal (the Q
signal, for example a sine wave) are amplitude modulated with a finite number
of amplitudes. It can be seen as a two channel system. The resulting signal is
a combination of PSK and ASK, with a finite number of
at least two phases, and a finite number of at least two amplitudes.
In the case of PSK,
ASK and QAM, the modulation alphabet is often
conveniently represented on a constellation
diagram, showing the amplitude of the I signal at
the x-axis, and the amplitude of the Q signal at the y-axis, for each symbol.
PSK and ASK, and sometimes also FSK, can be generated and detected using the principle of QAM. The I and Q message signals
can be combined into a complex valued
signal called the equivalent lowpass signal or equivalent
baseband signal. This is a representation of the real valued modulated physical signal (the so called passband signal or RF signal).
These are the general steps used by the
modulator to transmit data:
- Group
the incoming data into codewords;
- Map
the codewords to attributes, for example
amplitudes of the I and Q signals (the equivalent
low pass signal), or frequency or phase values.
- Apply
pulse shaping and/or other
filtering to limit the bandwidth and form the spectrum, typically using
digital signal processing.
- Digital-to-analog
conversion (DAC) of the I
and Q signals. Sometimes the next step is also achieved using DSP, and then the DAC should
be done after that.
- Pulse-amplitude
modulate (multiply) the high-frequency sine and cosine carrier waveform by
the I and Q signals, resulting in that the equivalent low pas signal is
frequency shifted into a modulated passband signal or RF
signal.
- Amplification
and analog bandpass filtering to avoid harmonic
distortion and periodic spectrum.
At the receiver, the demodulator typically
performs:
- Bandpass filtering
- Automatic
gain control, AGC (to compensate for varying
attenuation)
- Frequency
shifting of the RF signal to baseband I and Q
signals, or to an intermediate frequency (IF) signal.
- Sampling
and analog-to-digital conversion (ADC). (Sometimes before the above
point.)
- Filtering,
for example equalization (channel-adaptive filtering).
- Detection
of the amplitudes of the I and Q signals, or the frequency or phase of the
IF signal;
- Quantization
of the amplitudes, frequencies or phases to the nearest allowed values,
using mapping.
- Map
the quantized amplitudes, frequencies or phases to codewords
(bit groups);
- Parallel-to-serial
conversion of the codewords into a bit stream
- Pass
the resultant bit stream on for further processing such as removal of any
error-correcting codes.
Orthogonal Frequency
Division Multiplex (OFDM),
essentially the same thing as Coded OFDM (COFDM) and Discrete multi-tone modulation (DMT),
is based on the idea of Frequency Division Multiplex (FDM),
but is utilized as a digital modulation scheme. The bit stream is split into
several parallel data streams, each transferred over its own sub-carrier using
some conventional digital modulation scheme. The sub-carriers are summarized
into an OFDM symbol. The primary advantage of OFDM over single-carrier schemes is its ability to cope
with severe channel conditions — for example, multipath and narrowband
interference — without complex equalization filters. Channel equalization is
simplified because OFDM may be viewed as using many
slowly-modulated narrowband signals rather than one rapidly-modulated wideband
signal. Since the symbols are so long, it is affordable to include a guard
interval between each symbol, and thus avoid inter-symbol interference.
Capacity and performance of a communication system
Bandwidth: May denote one of the following:
-
Analog bandwidth in Hertz (Hz) of a signal or
communication channel. Measured in
Hertz (Hz). In case of a baseband channel or baseband signal, the bandwidth is
equivalent to the upper cut-off
frequency of the signal spectrum or the lowpass
filter. In case of a passband signal, it is the upper cut-off frequency minus the lower cut-off frequency of the signal spectrum or the bandpass filter.
-
Digital bandwidth consumption in bit/s. Proportional to the analog bandwidth of the signal. This may be
equivalent to the raw bitrate (inclusive of forward error correction codes,
synchronization and other physical layer protocol overhead), net bit rate (exclusive of forward
error correction codes), throughput, or goodput.
-
Channel capacity in bit/s. Maximum possible net bit
rate. Can be calculated by the Shannon-Hartley formula for a certain analog
channel bandwidth and signal-to-noise ratio.
Latency – Delay from transferring a message.
It may include:
-
Transmission
delay – time from the first until the last bit of a message or packet has left
the transmitter. (Message or packet length in bits divided by the bit rate.)
-
Propagation
delay – time from the message haft left the
transmitter until it has reached the receiver.(Distance divided by the
propagation speed).
-
Packet
queuing delay in store-and-forward packet mode nodes.
-
Protocol
overhead, caused by flow control, congestion avoidance, automatic repeat request
retransmissions, etc.
-
Processing
delay, due to slow electronic circuits, etc.
Bit Error Rate (BER) is the percentage of bits with errors divided by the
total number of bits that have been transmitted, received or processed over a
given time period.
Symbol Error Rate (SER) is the percentage of the modulated
symbols with errors divided by the total number of symbols that have been
transmitted, received or processed over a given time period.
Packet Error Rate (PER) is the percentage of the data packets
that are affected by at least one bit error.
Channel impairments
Noise - Fluctuations in and the addition of external
factors to the stream of target information (signal) being received at a
detector.
White Noise - Statistically random radio noise
characterized by a wide frequency spectrum with a constant spectral density N0 (expressed as W/Hz) over a
specified frequency band. If the noise signal is sampled (time discrete), consequtive
samples are independent, i.e. non-correlated.
Noise power spectral density N0(f). Expressed as
W/Hz, watts per hertz of bandwidth. If the noise is white, N0 is constant over the
studied band, and the noise power is N = N0B, where the B is the bandwidth.
Additive Gaussion
White Noise (AWGN) channel
– A communication channel model where the only impairment is linear addition of
white noise with Gaussian distribution of voltage or current values. Wideband Gaussian noise comes from
many natural sources, such as the thermal vibrations of atoms in antennas
(referred to as thermal noise or Johnson-Nyquist
noise), black body radiation from the earth and other warm objects, cross-talk
from and from celestial sources such as the sun. Sometimes interference
(crosstalk) from wideband signal sources, for example radio transmitters, is
included in the noise concept.
Signal-to-noise ratio (SNR) -
the power ratio between a signal (useful information) and the background noise:
S/N = Signal power / Noise power
= (Signal RMS
voltage/ Noise RMS voltage)2
SNR in dB = 10 log10 (S/N)
= 20 log10 (Signal RMS voltage/ Noise RMS voltage)
Carrier-to-noise ratio (CNR). Often the equivalent to the SNR. Used to analyze a modulated signal. C/N = carrier power /
Noise power. CNR in dB = 10 log10 (C/(I+N))
Co-channel interference – cross-talk between transmitters sending
at the same frequency channel.
Carrier-to-interference and noise ratio (CINR): Includes co-channel interference. C/(I+N) or in dB 10 log10 (C/(I+N)).
Often equivalent to SNR.
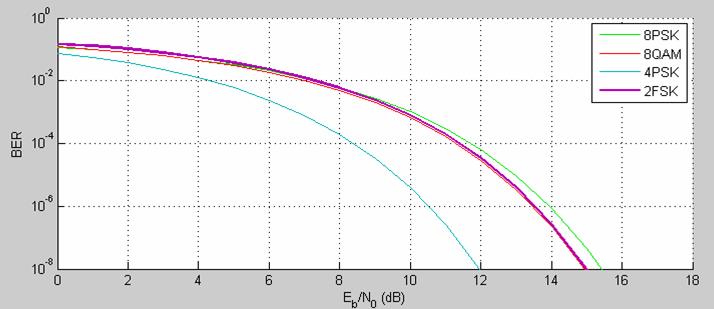
Eb/No – Energy per bit per noise power
spectral density: A normalized CNR measure, often
used when comparing the bit error rate (BER) of
different modulation methods without taking the bit rate or bandwidth into
consideration. See the example below.
The CNR can be calculcated as follows:
![]()
where R is the bitrate
in bit/s and B is the channel
bandwidth in Hertz.
Es/No
– Energy
per symbol per noise power spectral density. A normalized
measure of the CNR. Similar
usage as Eb/No.
BERTool – a graphical user interface (GUI)
in Matlab that enables you to analyze BER vs Es/No performance of a
communications links. via simulation-based, semianalytic, or theoretical approach.
Phase Noise – variation of the channel phase shift. May be caused by variating multi-path
propagation, Doppler shift and synchronization problems between the sender and
receiver local oscillators.
Error management
Forward error correction (FEC). An
encoder adds redundant data.
Block Coding: Is the technique by which the encoder
intersperses parity bits into the data sequence using a particular algebraic
algorithm.
Convolutional code: Is the process of encoding intersperses
parity bits into the data sequence in symbol streams of arbitrary length.
Error detection: Is the
ability to detect errors that are made due to niose
or other impairments in the course of the transmission from transmitter to
receiver
Code Rate = Message length(K)/Code
word length(N) = Net bit rate/Raw bit rate.
Cyclic Redundancy Check (CRC): It is a type of hash function
used to produce a checksum error detection code - which is a small, fixed number
of bits - against a block of data, such as a packet of network traffic or a
block of a computer file.
Cyclic Redundancy Check (CRC): An error checking technique used to
ensure the accuracy of transmitting digital data. CRC
Block Generator is used to achieve this function in Simulink.
Scrambler – In telecommunications, a scrambler is a
device that transposes or inverts signals or otherwise encodes a message at the
transmitter to make the message unintelligible at a receiver not eq>uipped with an
appropriately set descrambling device.
Samples, Frames and events
Multirate models = A model that contains signals with different
sample times.
A Frame is a
sequence of samples combined into a single vector
Sample time =
Updating a signal integer multiples of a fixed time interval called the sample
time
Samples per frame =
How many samples each frame contains.
Sample time =
Frame period / Samples per frame
In frame-based processing all the
samples in a frame are processed simultaneously.
In sample-based processing samples are processed one at a time.
Signals
A signal is
a function representing some variable that contains some information about the
behavior of a natural or artificial system.
Scalability -
Spectrum’s software reconfigurable platforms
Spectral
Analysis:-
The goal of spectral estimation is to describe the distribution (over
frequency) of the power contained in a signal, based on a finite set of data.
Bandwidth:- Compute the frequency response
bandwidth, or Bandwidth
is the name for the frequency range that a signal requires for transmission,
and is also a name for the frequency capacity of a particular transmission
medium.
Sampling is the process of converting
continuous data into discrete data.
Sample refers to a value or set of values
at a point in time and/or space
The
sampling theorem is written as follows:
![]()
using this theory, we can extract a single value
from a continuous function by mulitplying with an
impulse, and then integrating.
Quantization:-
The
conversion from an infinitely precise amplitude to a binary number is called quantization.´
Sampling
frequency or
Sampling rate
The sampling frequency or sampling rate defines the number of samples
per second taken
from a continuous signal to make a discrete
signal.
 Continuous signal or a Continuous time signal
A continuous
signal or a continuous time
signal is a varying quantity (a signal) that can be, or is expressed, as
a continuous function of an independent variable, usually time.
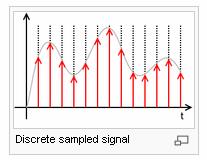 discrete signal
A discrete
signal is a signal that has been sampled from a continuous
signal. Unlike a continuous signal, a discrete signal is not a continuous function but a sequence.
Source Coding:-
Source coding, also known as quantization or
signal formatting, is a way of processing data to reduce redundancy or prepare it
for later processing.
LF = Low Frequency
sonar system, operating from 60 kHz to 120 kHz.
HF = High Frequency sonar system, operating from
135 kHz to 200 kHz.
Pulse: A precisely characterized transmission of acoustic
energy from a transducer. A short burst of sound at the operating frequency of
the sonar (Echoview glossary).
Recorded Signal: A time-series of
acoustic energy recorded for a specific duration of time by the transducer
immediately following the transmission of a pulse.
Maximum Response Axis (MRA) - The MRA (or acoustic axis, or beam axis) of a beam is defined
as the direction in which the acoustic response has its maximum value.
Spectrum Viewer for estimating and
analyzing a signal's power spectral density (PSD).
Filtering
and FFTs
There are two types of filters in
the digital realm: Infinite Impulse Response (IIR)
filters, and Finite Impulse Response (FIR) filters.
1.1
FIR Filters
FIR filters, which are conceptually the easiest
to understand and the easiest to design. However, FIR filters suffer from low
efficiency, and creating an FIR to meet a given spec requires more hardware
then an equivalent IIR filter. FIR filters have no
feedback elements in the filters.
1.2
IIR Filters
IIR filters are harder to design then the FIR
filters, but the benefits are extraordinary: IIR
filters are an order of magnitude more efficient then an equivalent FIR
filter. even though FIR is easier to design, IIR will do the same work with fewer components, and fewer
components translate directly to less money. IIR
filters differ from FIR filters because they contain feedback elements in the
circuit, which can make the transfer functions more complicated to work with.
Digitizing, or Digitization
Digitizing, or digitization, is the
process of turning an analog signal into a digital representation
of that signal
Anti-Aliasing Filter
An anti-aliasing
filter is commonly used in conjuction with digital signal processing and is a filter
to restrict the bandwidth to approximately satisfy the Shannon-Nyquist
sampling theorem.
e hertz is defined as one cycle per second. => 1 Hz = 1 s−1
1.3
SI multiples
|
Multiple |
Name |
Symbol |
|
Multiple |
Name |
Symbol |
|
100 |
hertz |
Hz |
|
|
|
|
|
101 |
decahertz |
daHz |
|
10–1 |
decihertz |
dHz |
|
102 |
hectohertz |
hHz |
|
10–2 |
centihertz |
cHz |
|
103 |
kilohertz |
kHz |
|
10–3 |
millihertz |
mHz |
|
106 |
megahertz |
MHz |
|
10–6 |
microhertz |
µHz |
|
109 |
gigahertz |
GHz |
|
10–9 |
nanohertz |
nHz |
|
1012 |
terahertz |
THz |
|
10–12 |
picohertz |
pHz |
|
1015 |
petahertz |
PHz |
|
10–15 |
femtohertz |
fHz |
|
1018 |
exahertz |
EHz |
|
10–18 |
attohertz |
aHz |
|
1021 |
zettahertz |
ZHz |
|
10–21 |
zeptohertz |
zHz |
|
1024 |
yottahertz |
YHz |
|
10–24 |
yoctohertz |
yHz |
Sequence generators
To generate sequence of
bits as an input or source of our model we can use sequence generators.
Pseudoramdom sequences
Following blocks generate PN
(pseudonoise sequences)
Gold sequence
generator , kasami sequence
generator and PN sequence generator.
Synchronization codes
The Barker Code Generator block generates Barker
codes to perform synchronization. Barker codes are subsets of PN sequences.
Orthogonal codes
Orthogonal codes are used in systems in which the
receiver is perfectly synchronized with the transmitter
Gaussian
noise
Rayleigh
noise
Rician
noise
Different
type of noises in the channel
SAMPLE TIME
For sample based signals
it is the time interval between successive updates of the signal. For frame based matrix signals it is the time
interval between successive rows of frame based matrix.
Seed
It is the initial value for a random sequence
generator (recommended to use a prime number greater than 30)
Eye diagram
It is a tool to represent intersymbol
interference and other impairments in digital transmision.
Scatter diagram
A scatter plot of a
signal plots the signal value at its dicision
points. The decision points is the one
where signal parameter(like strenght,
direction, frequency, amplitude) changes
Trajectory diagram
We can plot the points
on a two dimentional graph which is some times called
trajectory diagram.
Error rate
Errors occuring
per second in the channel.